Monitoring
In order to monitor your Anka Build Cloud, you’ll need a few things:
A way to collect and aggregate logs.
A way to search and even set up alerts for log occurrences.
A way to collect metrics (time series database, etc).
A way to graph and setup alerts from those metrics.
Let’s start with logs…
Logs
The Anka Build Cloud agent attempts to retry failures, however, it’s still a good idea to look for certain types of errors occurring in your setup and handle them before they become larger problems. We’re going to walk you through where important logs are found and then what to look for and trigger alerts on.
Nodes
On your Anka Nodes runs the Controller Agent, handling communication to the Anka Build Cloud. This agent logs to /var/log/veertu.
- Logs location:
/var/log/veertu - Format:
regd.HOSTNAME.USER.LOG.LOGTYPE.TIMESTAMP
There are 5 type of symlinks in the logs location pointing to the latest active logs. The verbosity of the logs are from highest (INFO) to the lowest (ERROR):
anka_agent.INFO- contains all of the below except for CMD log.anka_agent.WARNING- contains WARNNIGS & ERRORS.anka_agent.ERROR- contains just ERRORS.anka_agent.FATAL- only FATAL ERRORS.anka_agent.CMD- (new in 1.20.0) contains the various anka commands the agent is executing on the host as well as the returned data.
You can also read and download the logs via the UI in the Controller dashboard. Though, only relevant if you’ve joined your Node to the Build Cloud Controller & Registry.
Node Common Errors
can't start vm
- These errors are thrown at the end of a start VM task attempt by the Node. It’s a generic error and not specific. However, if enough of these are thrown in a short amount of time, you should dig in further.
- Alerts should trigger when more than 3 of these happen in a 20 minute time period.
rejecting due to lack of disk space
- These errors happen when the Node itself can’t handle the amount of disk space needed for the VM template it’s about to pull. This means either 1. your individual VM templates are too large and need to be optimized a bit, and/or 2. your node just doesn’t have enough space for the amount of templates it needs to hold.
- Alerts should trigger when more than 3 of these happen in a 60 minute time period.
- Also, the agent will delete the least used templates one by one from the Node until it has enough space to download. On top of that, the node will not take new tasks while it’s pulling. You can experience a situation where two massive templates that cannot both exists on the host due to their size will cause the node to clean up one to pull the other over and over, all while locking task processing for other unrelated jobs. The Node will be useless while it’s pulling.
Controller
Central to the Anka Build Cloud is the Controller, handling the UI/visual interaction for users, APIs, Queuing of tasks, etc. Behind it is ETCD, handling storage of temporary information used by the Controller.
Error logs are formatted starting with severity as a character: I as Information, W as Warning, and E as Error:
E0501 12:32:30.426698 341 controller.go:114] StartVm: failed to get VM 7141d04e-cb45-46bf-9026-4266d74998d5 from registry
Unless your ETCD is run separately (like in the case of docker), the logs for both services are combined.
Some error are not critical and can be ignored. Feel free to contact support for confirmation of any of these you find.
Docker
Using the docker logs command: docker logs --follow <ControllerContainerName>
The controller is an API, so all API connections made to it from Anka-agent or CI platforms(Jenkins) logs here. If a vm fails to start it suggests first to check this logs.
Mac Package
- Logs location :
/Library/Logs/Veertu/AnkaController
Show logs by command:
sudo anka-controller logs- Press Ctrl+C to exit.There are 4 types of log files, in the snapshot you can see log files without ID, they are LINK files- point to the latest log been created ( the last active vm) , each vm can generate all of the log types below. the robosety of the logs are from highest(INFO) to the lowest(ERROR), you can check this files using ’tail’ command:
anka-controller.INFO- contains ALL logs.anka-controller.WARNING- contains WARNINGS & ERRORS.anka-controller.ERROR- contains just ERRORS.anka_agent.FATAL- Only FATAL ERRORS (both controller and agent).
The controller is an API, so all the communication made from Anka-agent or CI platforms(Jenkins) stored in the controller logs. If a vm fails to start it suggests first to check this logs.
The controller relies on an internal ETCD database. Logs for ETCD will be included in the controller logs, but by default they are set to be non-verbose.
Controller/ETCD Common Errors
- [etcd]
database space exceeded
- This is detailed in the official documentation.
- You should alert on this immediately. It is a critical error.
Registry
The Registry stores your Anka VM Templates and Tags. It is also responsible for storage of the Centralized Logs (all other components post their logs to it). It is very uncommon to find errors in the logs, but you should still become familiar with where they are.
Docker
- Logs location: Registry storage directory under
files/central-logs.
Using the
docker logscommand:docker logs --follow <RegistryContainerName>.The Registry and Controller logs share the same file and are available under the Controller’s
Logs>Service Name: Controller.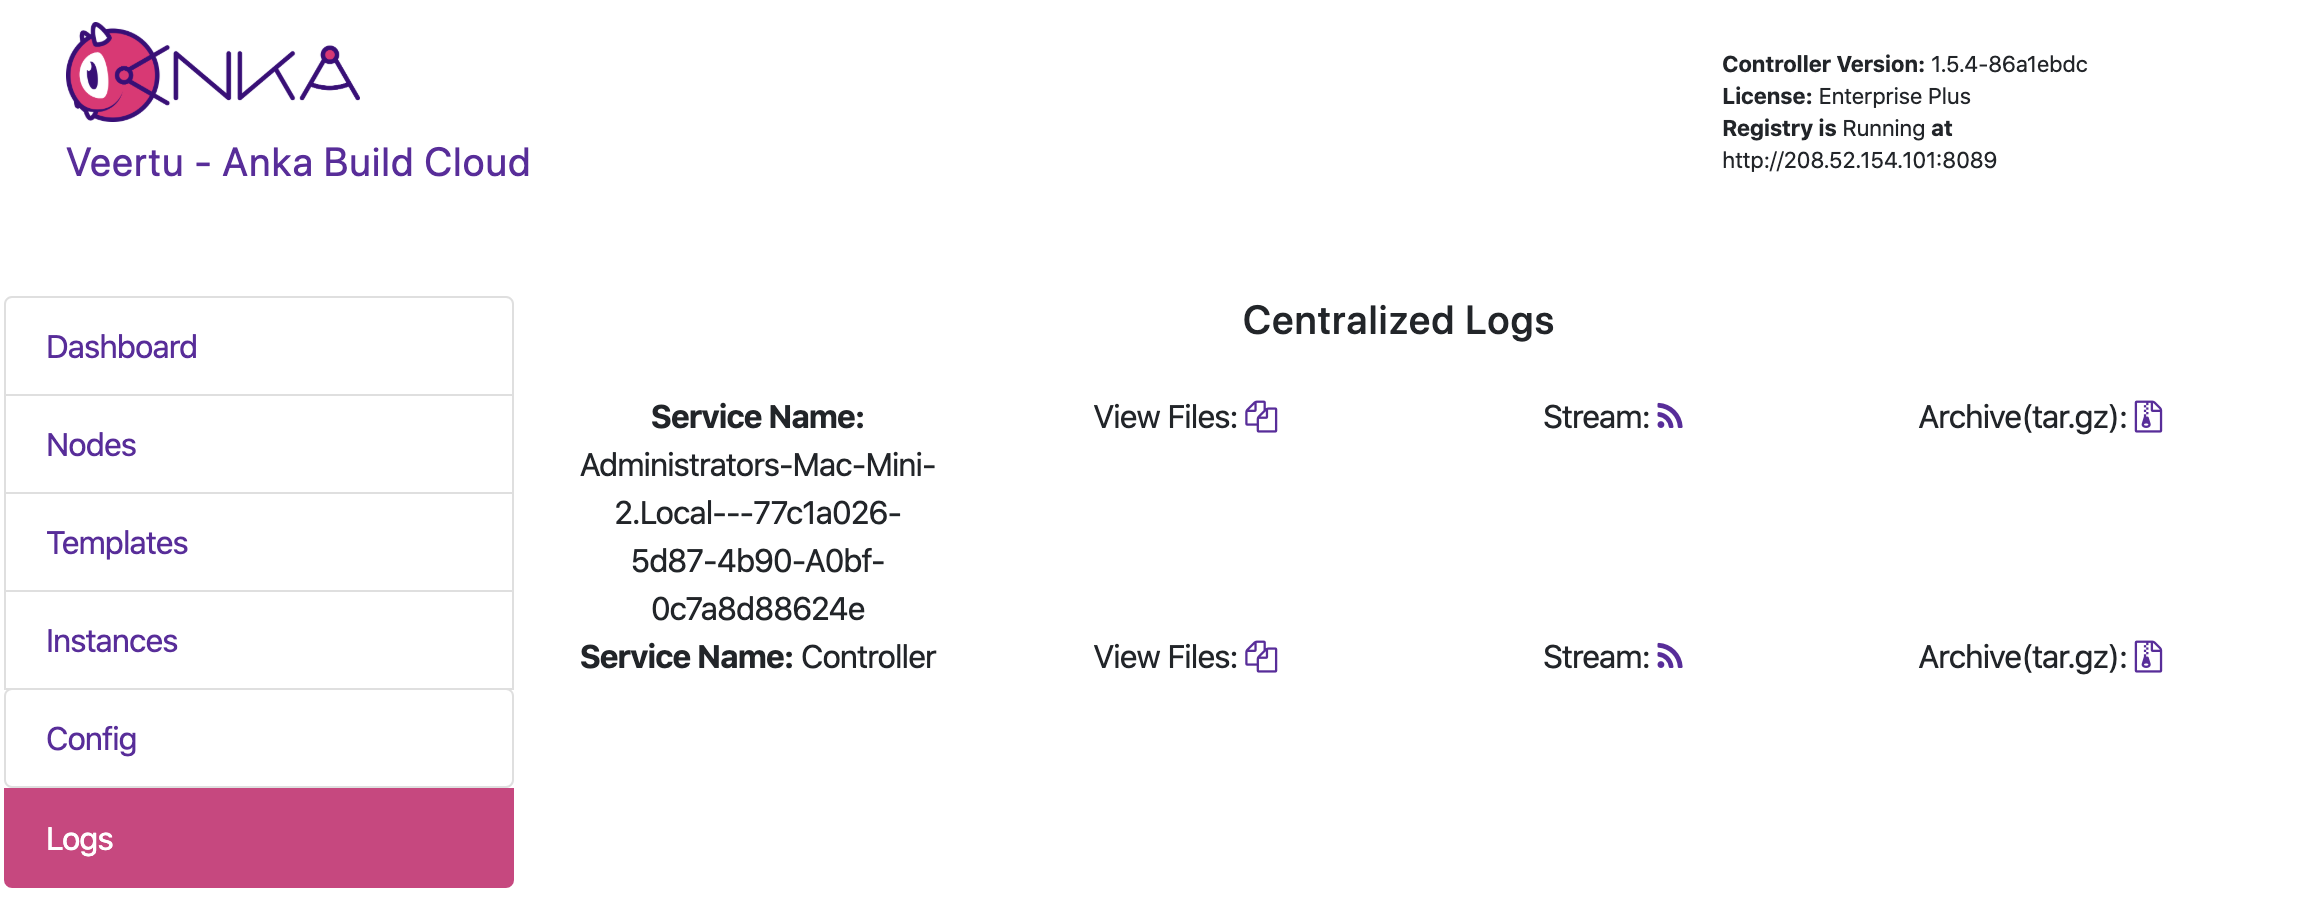
Mac Package
Logs location:
/var/log/veertuFormat:
regd.HOSTNAME.USER.LOG.LOGTYPE.TIMESTAMP
There are 4 type of symlinks in the logs location pointing to the latest active logs. The verbosity of the logs are from highest (INFO) to the lowest (ERROR):
regd.INFO- contains ALL logs.regd.WARNING- contains WARNINGS & ERRORS.regd.ERROR- contains just ERRORS.regd.FATAL- only FATAL ERRORS.
You can also read and download the logs via the UI in the Controller dashboard. Only relevant if you’ve joined your Node to the Build Cloud Controller & Registry.
Usage Metrics
Prometheus + Grafana
Release Notes can be found on the official Github repo.
Prometheus is a powerful monitoring and alerting toolkit. You can use it to store Anka Controller, Registry, and VM metrics to build out or integrating into existing graphing tools like Grafana.
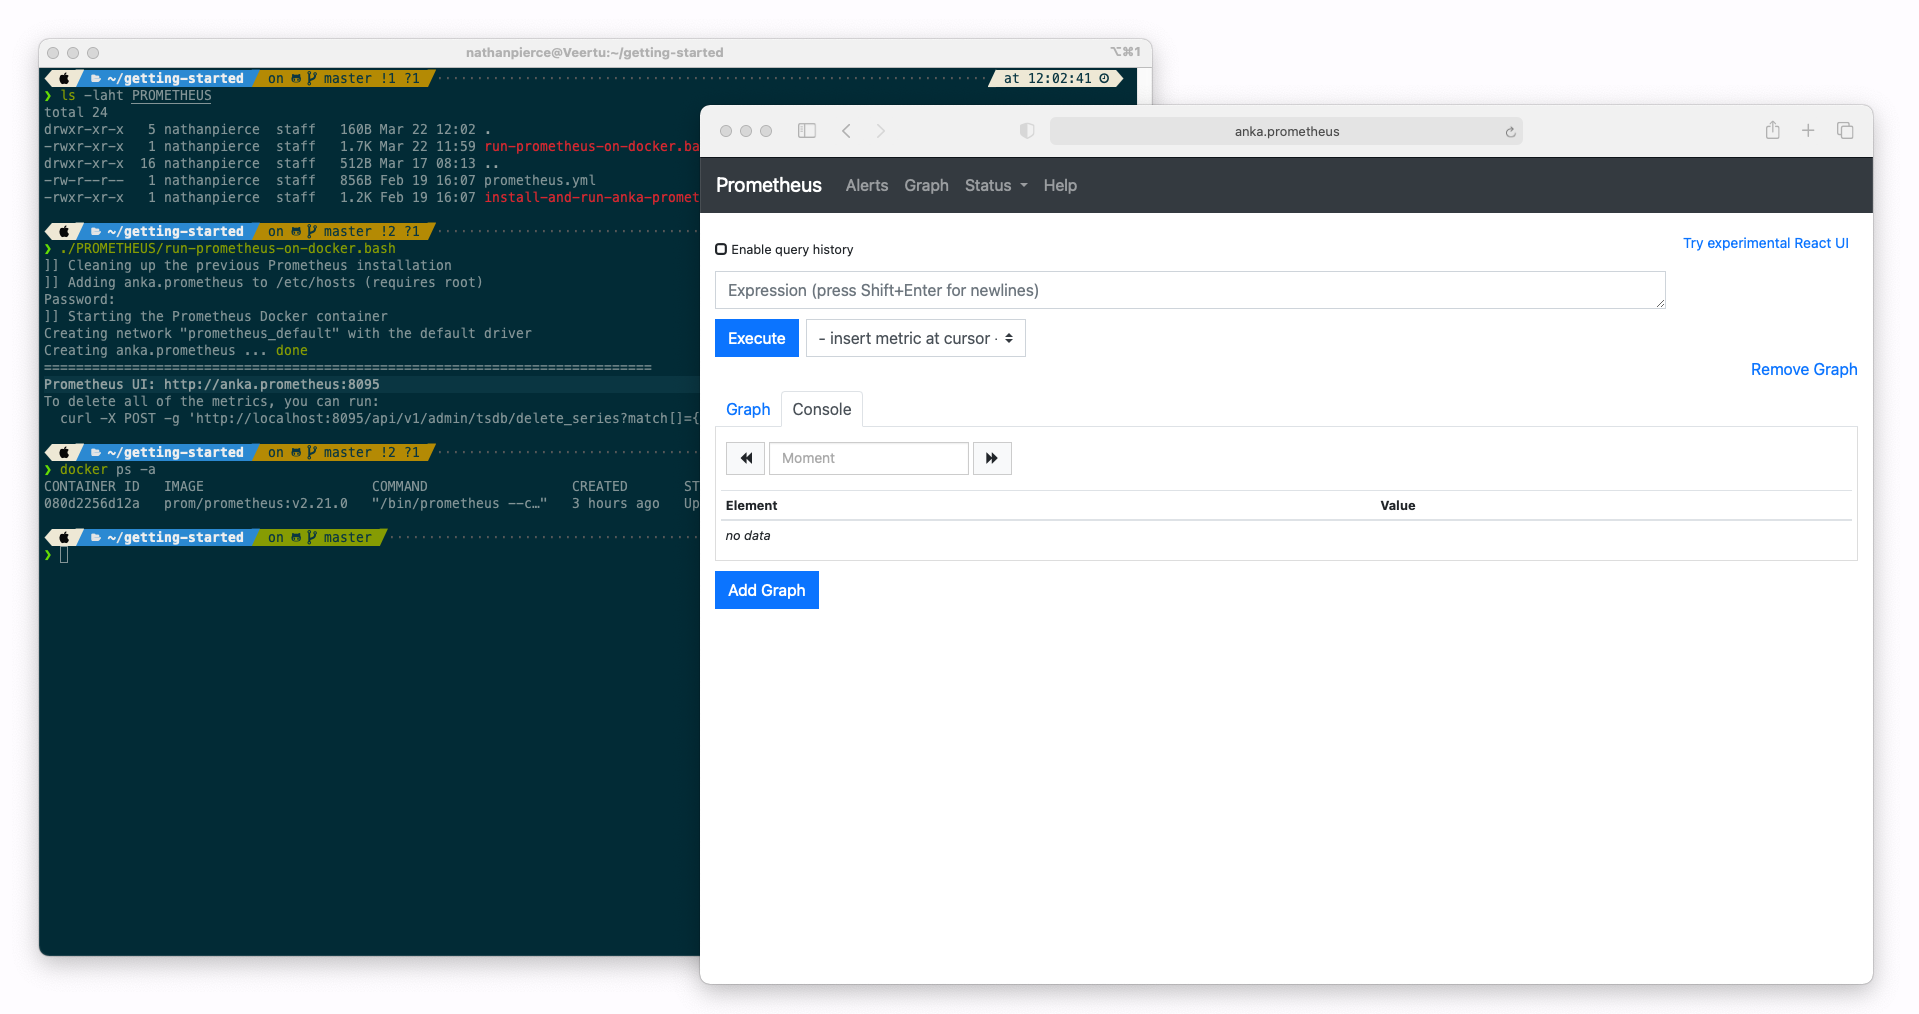
While exactly how you should install Prometheus and Grafana are outside of our bounds of support, we do have a way to set it up locally (using docker), connect it to your Build Cloud Controller, and start playing around on your machine. The script you can run to achieve this can be found on our Getting Started Github Repo.
Once the getting-started repo is cloned into your local machine, you need to start a docker container with Prometheus. Execute the run in docker script: cd getting-started && ./PROMETHEUS/run-prometheus-on-docker.bash. Once running, visit the url and port it created for you (shown in the output of the script).
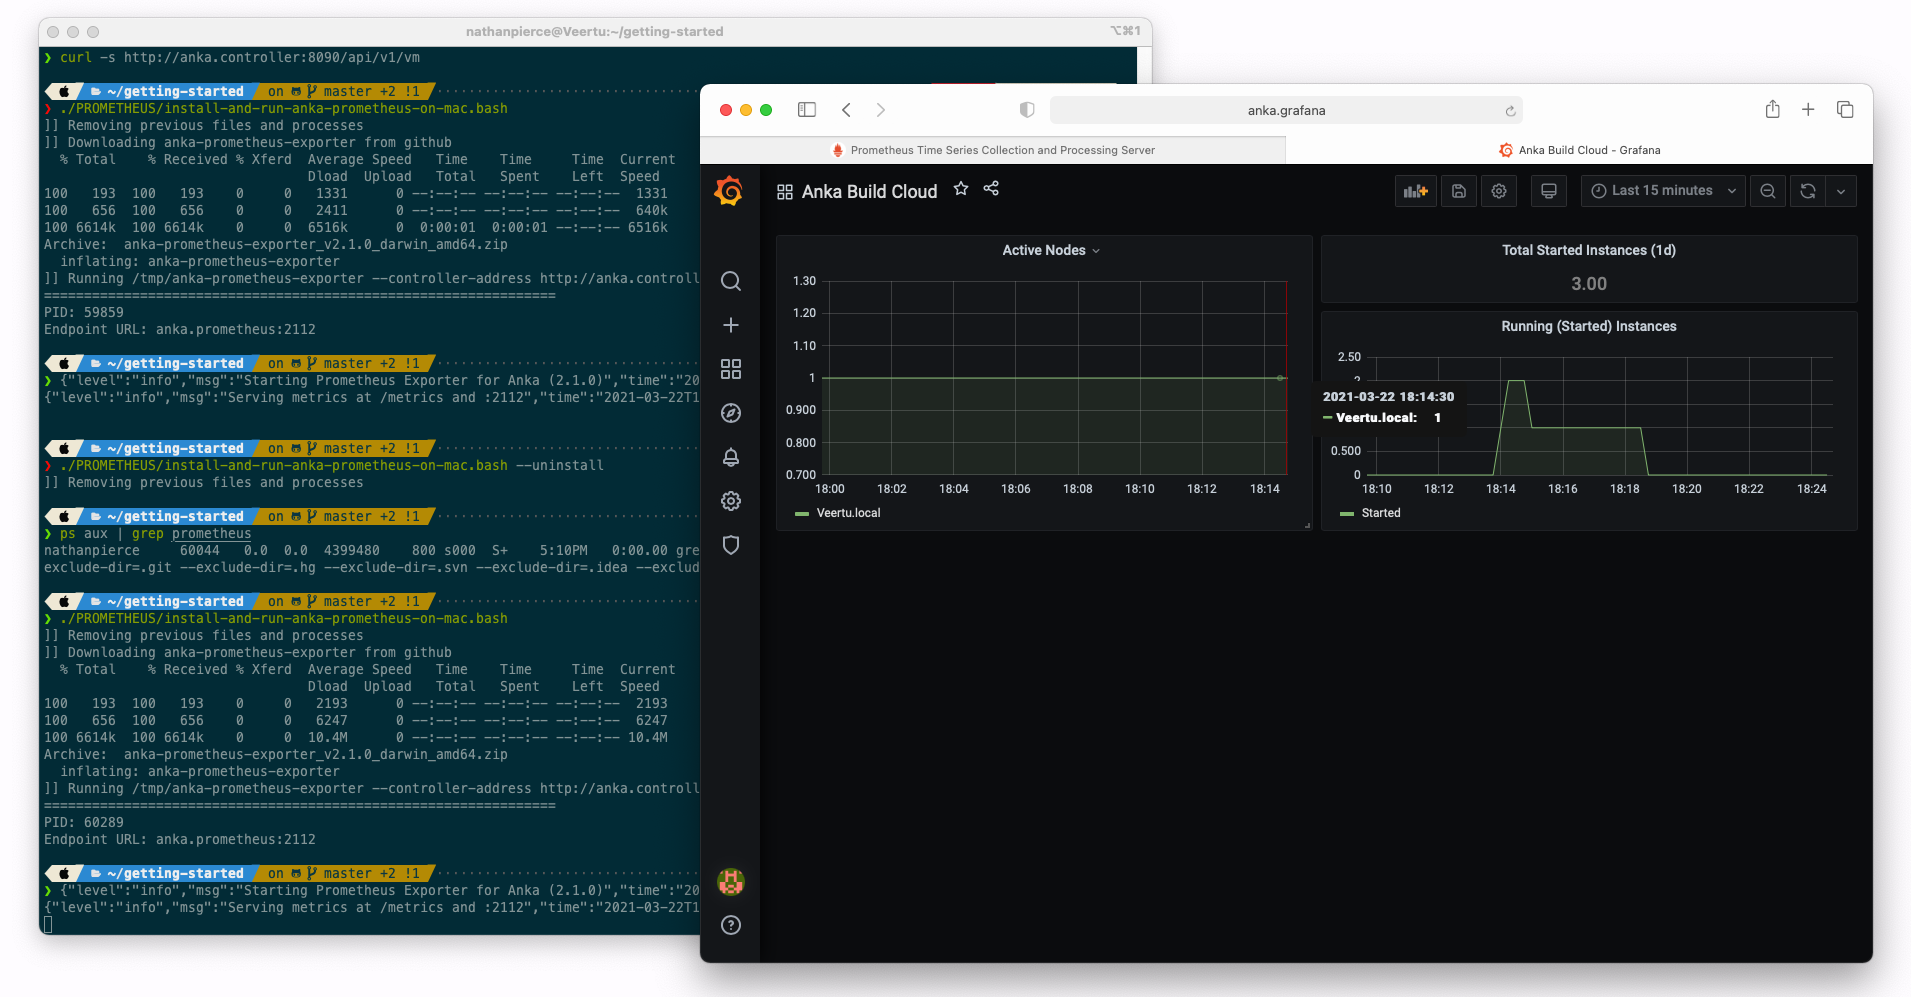
Prometheus does not collect metrics from the Anka Build Cloud by default. You’ll need to run the Anka Prometheus Exporter for that. Use the Getting Started Github Repo script for this:
❯ ./PROMETHEUS/install-and-run-anka-prometheus-on-mac.bash
]] Removing previous files and processes
]] Downloading anka-prometheus-exporter from github
  % Total    % Received % Xferd  Average Speed   Time    Time     Time  Current
                                 Dload  Upload   Total   Spent    Left  Speed
100   193  100   193    0     0   1331      0 --:--:-- --:--:-- --:--:--  1331
100   656  100   656    0     0   2429      0 --:--:-- --:--:-- --:--:--  2429
100 6614k  100 6614k    0     0  7440k      0 --:--:-- --:--:-- --:--:-- 7440k
Archive:  anka-prometheus-exporter_v2.1.0_darwin_amd64.zip
  inflating: anka-prometheus-exporter
]] Running /tmp/anka-prometheus-exporter --controller-address http://anka.controller and backgrounding the process
================================================================
PID: 2323
Endpoint URL: anka.prometheus:2112
❯ {"level":"info","msg":"Starting Prometheus Exporter for Anka (2.1.0)","time":"2021-03-22T15:19:17-04:00"}
{"level":"info","msg":"Serving metrics at /metrics and :2112","time":"2021-03-22T15:19:17-04:00"}
This will run the exporter in the background (it will not be available after you reboot your machine and you’ll have to re-run the script). The exporter is setup, by default, to connect to http://anka.controller and your controller may not be running at this URL and port. Feel free to modify the script!
Next, you’ll want to confirm that the metrics are now available in Prometheus.
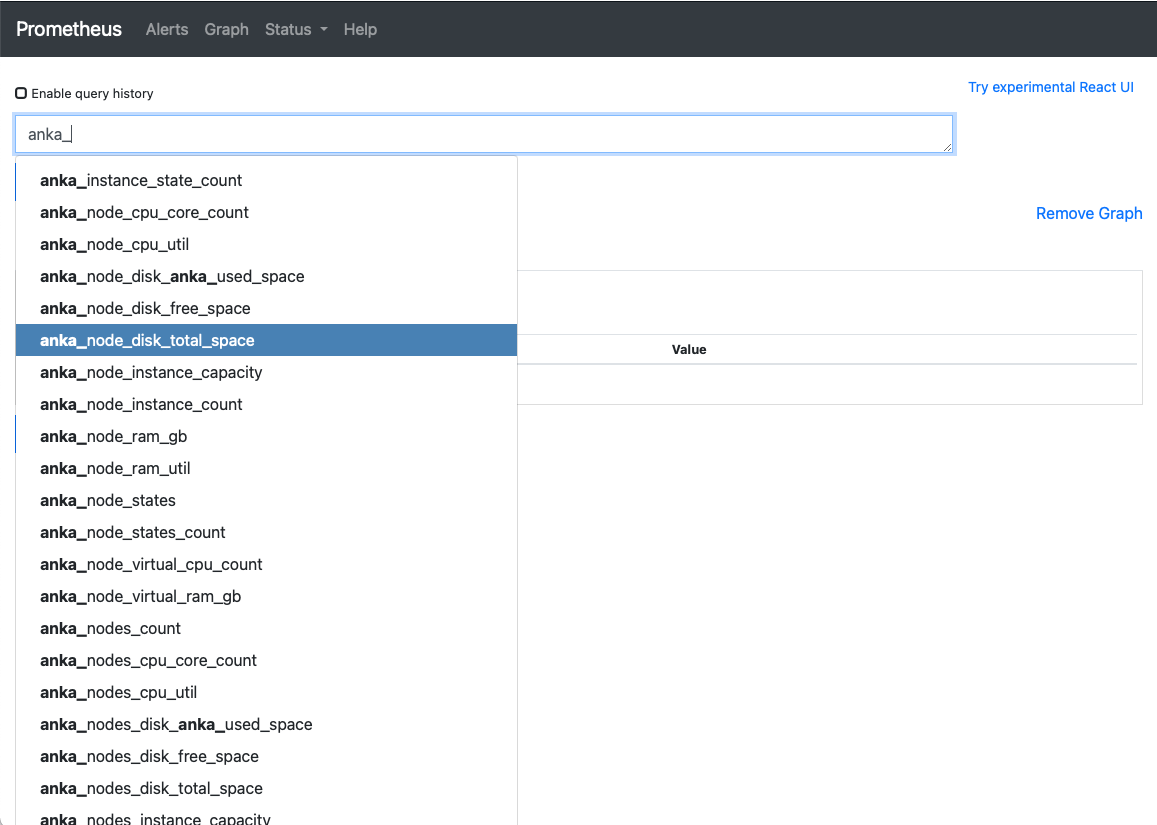
Once you’ve confirmed the metric are available, you can now use the built in graph and alerting for several metrics. For example: anka_node_states to see when Node connectivity to the controller fails, anka_instance_state_count to see when instances are throwing errors, anka_node_cpu_util to trigger alarms when VMs are crippling the Node, and much more. A full list of metrics is available at https://github.com/veertuinc/anka-prometheus-exporter#exposed-metrics.
We won’t go into depth with setting up Grafana as it’s already covered on https://grafana.com/docs/grafana/latest/getting-started/getting-started-prometheus/.
Grafana will need to connect to the host and port for Prometheus. This is available at
http://host.docker.internal:8095if you used the scripts in the Getting Started repo.
Recommended Alerts
- Total Free Capacity across all Nodes is 0 for more than 15 minutes. This typically means you need more Nodes to handle the VM start request load.
- Registry Available Space is less than 70GB. We recommend keeping your Registry free space at 50GB or more.
- Usage of a specific VM Template is 0 over a week period. This usually means that a Template is ready to be deletes as it is no longer used.